We estimate that the U.S. federal government faces a permanent fiscal imbalance equal to over 10 percent of all future GDP under current law where future federal spending outpaces tax and related receipts. Federal government debt will climb to 236 percent of GDP by 2050 and to over 800 percent of GDP by year 2095 (within 75 years).
Effects of a State Gasoline Tax Holiday
We provide causal evidence that recent suspensions of state gasoline taxes in three states were mostly passed onto consumers at some point during the tax holiday in the form of lower gas prices: Maryland (72 percent of tax savings passed onto consumers), Georgia (58 percent to 65 percent) and Connecticut (71 percent to 87 percent). However, these price reductions were often not sustained during the entire holiday.
Total Cost of Universal Pre-K, Including New Facilities
We estimate that each new preschooler for a universal pre-K program requires about $21,000 in new construction costs for facilities expansion. Including non-construction costs, a universal pre-K program for three- and four-year-olds will cost about $351 billion over the 10-year budget window. If made permanent after 10 years, this program will have essentially no impact on long-run GDP. A pre-K program for just four-year-olds reduces the 10-year cost to $196 billion and slightly increases long-run GDP, if that program is made permanent.
Why Taxpayers Owed $500 Billion in Taxes When They Filed This Year
Households owed more than $500 billion in taxes when they filed their returns this year, an increase of about $200 billion from immediately prior to the pandemic. The large tax liability owed at filing is mostly the result of a surge in capital gains and other income from financial assets in 2021.
President Biden’s FY2023 Budget Proposal: Budgetary and Economic Effects
We project that President Biden’s FY2023 Budget, taken as a whole, would reduce debt and grow the economy by 0.4 percent over time, with two major components of the Budget---"Build Back Better” and “New Provisions”---working in opposite directions.
Analysis of Carbon Emission Reductions in Build Back America
Build Back Better (BBB) Act allocates about $550 billion to climate change policies. Provisions that are funded with user fees can grow the economy while deficit financing can shrink the economy.
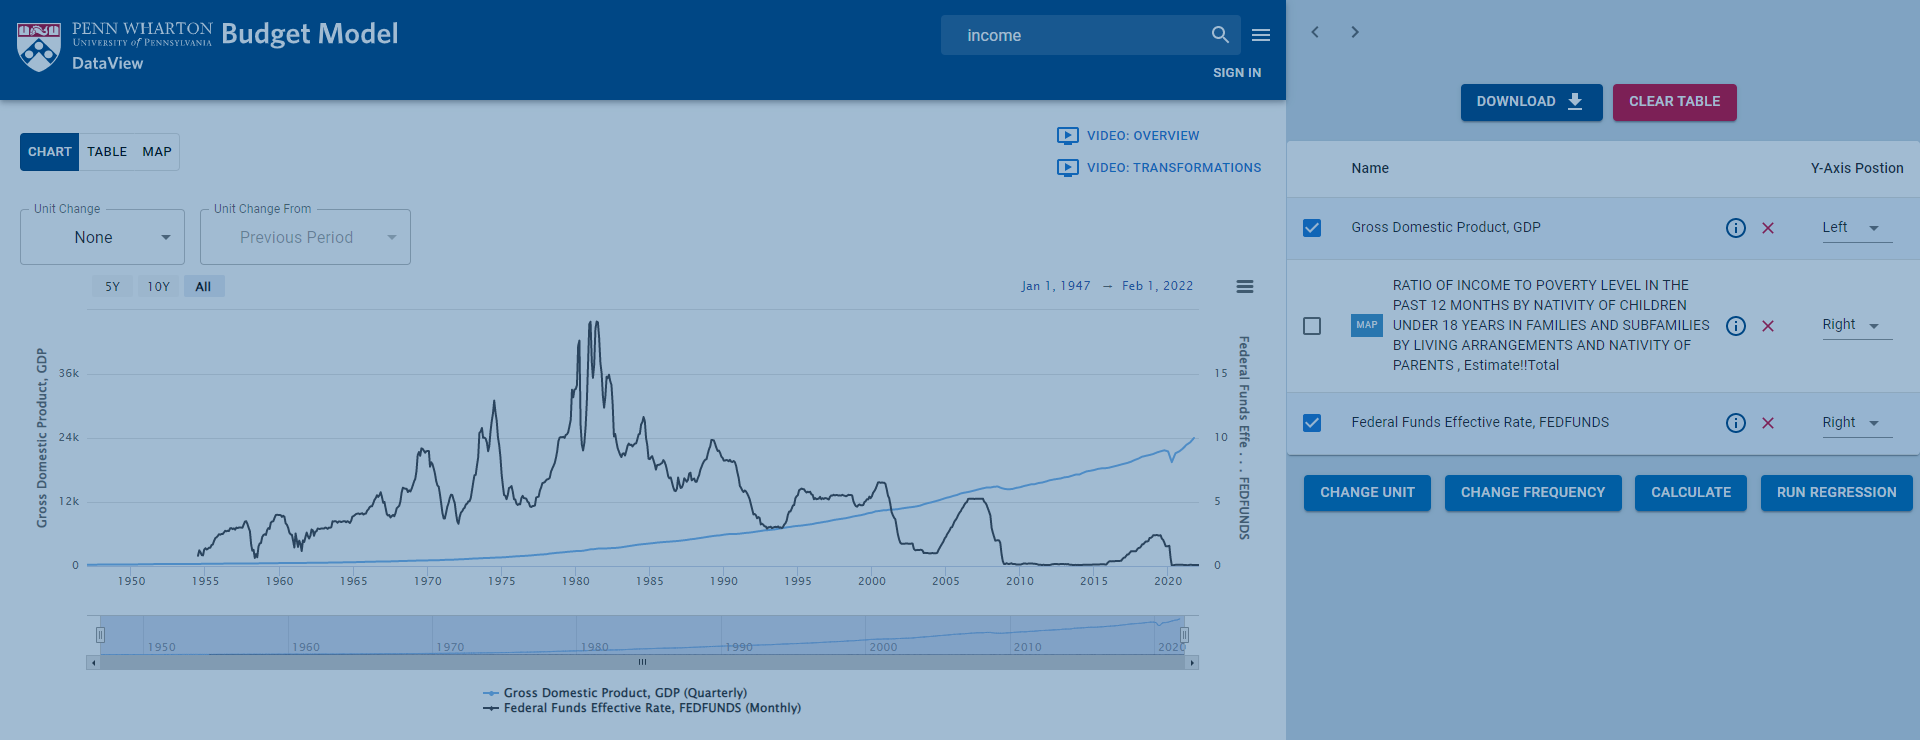
Introducing PWBM's DataView
DataView is a powerful new tool that simplifies collecting, visualizing, and analyzing government and other public data:
Search across millions of data series available from dozens of sources.
Transform and combine data as desired using simple “point and click”.
Visualize your data with graphs, tables, scatterplots, and animated US maps.
Test your ideas using integrated regression analysis.
Create an account to save your work for later as well as share with others.
Effects of a Federal Gas Tax Holiday
We estimate that suspending the federal gas tax from March to December 2022 would lower average gasoline spending per capita between $16 and $47, depending on geographic location and assumptions, but lower federal tax revenue by about $20 billion over that period.
Projecting Medicaid’s Long Term Care Expenditures
PWBM estimates that Medicaid’s inflation adjusted expenditures on Long Term Care services will increase from $130 billion in 2020 (0.62 percent of GDP) to $179 billion in 2030 (0.71 percent of GDP). We project that Medicaid expenditures on Nursing Home and Home Health will increase 4.7 percent and 6.9 percent per year above inflation through 2030, respectively.
Capital Gains Taxation and Deferral: Revenue Potential of Reform
This brief examines different approaches to removing the capital gains “lock-in effect” within a realization-based tax framework. We estimate that this change would produce between $115 billion and $357 billion in additional tax revenue over the next 10 years, depending on the exact design.
Medicare Advantage Auto-Enrollment
PWBM estimates that auto-enrolling into a Medicare Advantage (MA) plan those who age into Medicare and fail to sign up for Medicare Fee-For-Service (FFS) or another MA plan would increase enrollment in the MA program by 1.4 million people in 2032 and increase federal outlays by $189 billion over the 2022-32 period. If we assume that in response to such a policy change people would lose the incentive to enroll in Medicare FFS and instead get automatically enrolled into a MA plan, enrollment would increase by 6.8 million people in 2032 and outlays would increase by $269 billion over the 2022-32 period.
Did Wages Keep Up With Inflation in 2021?
We estimate that increases in wage earnings in 2021 offset the higher cost of living due to inflation for most households with incomes between $20,000 and $100,000. Higher-income households saw their earnings rise by more than their cost of living, while the lowest-income households (below $20,000) saw their earnings rise by only one third of their increase in cost of living.
W2022-1 Immigration and the macroeconomy
Authors: Efraim Berkovich, Daniela Costa, and Austin Herrick
The Impact of the Build Back Better Act (H.R. 5376) on Inflation
PWBM projects that the spending and taxes in the Build Back Better Act (H.R. 5376), as written, would add up to 0.2 percentage points to inflation over the next two years and reduce inflation by similar amounts later in the decade. As an illustrative alternative, if temporary major spending provisions were made permanent, the bill would add up to a third of a percentage point to near-term inflation and have a negligible impact on inflation later in the decade.
Inheritances by race
We estimate that White households inherit over 5.3 times as much as Black households and 6.4 times as much as Hispanic households. White households are 2.8 times more likely than Black households to inherit any wealth. Differences in inheritances reflect and may contribute to wealth differences by race.
Impact of Inflation by Household Income
We estimate that inflation in 2021 will require the average U.S. household to spend around $3,500 more in 2021 to achieve the same level of consumption of goods and services as in recent previous years (2019 or 2020). Moreover, we estimate that lower-income households spend more of their budget on goods and services that have been more impacted by inflation. Lower-income households will have to spend about 7 percent more while higher-income households will have to spend about 6 percent more.
H.R. 5376, Build Back Better Act: Budget and Macroeconomic Effects
PWBM estimates that H.R. 5376, the Build Back Better Act, would increase spending by $2.1 trillion over the 10-year budget window while increasing revenue by $1.8 trillion, for a 10-year deficit of $274 billion. By 2050, the proposal would decrease GDP by 0.2 percent, relative to current law.
Senator Wyden’s Billionaires Income Tax: Budgetary Effects
PWBM projects that Sen. Wyden’s billionaire income tax proposal would raise $507 billion over the budget window, more than half of which would come from a one-time transition tax on previously accrued, unrealized capital gains on publicly traded assets.
Macroeconomic Effects of the White House Build Back Better Budget Reconciliation Framework
PWBM estimates that the White House’s Build Back Better reconciliation framework would increase spending by $1.87 trillion over the 10-year budget window and revenues by $1.56 trillion over the same period. By 2050, the proposal would increase federal debt by 2.0 percent and decrease GDP by 0.1 percent, relative to the current law baseline.
COVID-19 Learning Loss: Long-run Macroeconomic Effects Update
Using recently available data on learning loss from pandemic school closures, PWBM estimates that projected 2051 GDP is 1.4 percent lower than it would have been without the learning loss. Extending the 2021-22 school year for all public schools by one month would cost $78 billion and limit the reduction in 2051 GDP to 1.0 percent—a net present value gain in GDP of more than $1 trillion over the next three decades, equal to a $15.14 return for each $1 invested.


